Solar Panels Not Producing Expected Output? A Diagnostic Guide
Quick answer: If your solar panels are producing less than expected, start with the simplest explanations: time of day, weather, and shading. About 70% of the “my panels aren’t working” posts I see in forums are actually expectation mismatches — people comparing noon ratings to morning output. The other 30% are usually partial shading, dirty panels, or a wiring issue. Grab a multimeter and follow this guide from top to bottom.
Before You Troubleshoot: Check Your Expectations
Most solar panels are rated under Standard Test Conditions (STC): 1000 W/m² irradiance, 25°C cell temperature, AM 1.5 spectrum. You can estimate realistic output for your location using the PVWatts calculator from the National Laboratory of the Rockies. Those conditions basically never happen in the real world simultaneously. Here’s what to actually expect:
- Peak output: 75-85% of rated power on a clear day at solar noon. A 400W panel realistically peaks around 300-340W.
- Daily average: Much lower. Morning and evening hours contribute far less. A 400W panel in a good location might average 200-250W over a full sun day.
- Seasonal variation: Winter output can be 30-50% of summer output depending on latitude. If you installed in summer and it’s now November, a drop is completely normal.
Use our Solar System Sizer to see what output is realistic for your location and panel configuration. If your actual output roughly matches those numbers, your system is fine — your expectations just needed calibrating.
Step 1: Check the Obvious — Weather and Time of Day
This sounds basic, but I’ve panic-checked my own system on an overcast morning only to realize the clouds were the entire problem.
What to Check
- Is it cloudy? Overcast skies can reduce output by 50-80%. Thin clouds might only cut 20-30%.
- What time is it? At 9 AM, your panels might only produce 50-60% of their noon peak. By 4 PM, you’re back down to similar levels.
- What’s the sun angle? In winter, the sun sits lower in the sky. If your panels are fixed at a summer-optimized tilt, winter performance drops significantly.
- Is it hot? This one surprises people. Solar panels lose efficiency as they heat up — roughly 0.3-0.5% per degree Celsius above 25°C. On a 40°C (104°F) day, cell temperatures can hit 65°C or higher, costing you 12-20% of rated output. Summer doesn’t automatically mean maximum production.
What’s Normal
If the output matches conditions — lower on cloudy days, lower in morning/evening, lower in winter — your panels are working correctly. Move on only if the output seems low for the current conditions.
Step 2: Inspect for Shading
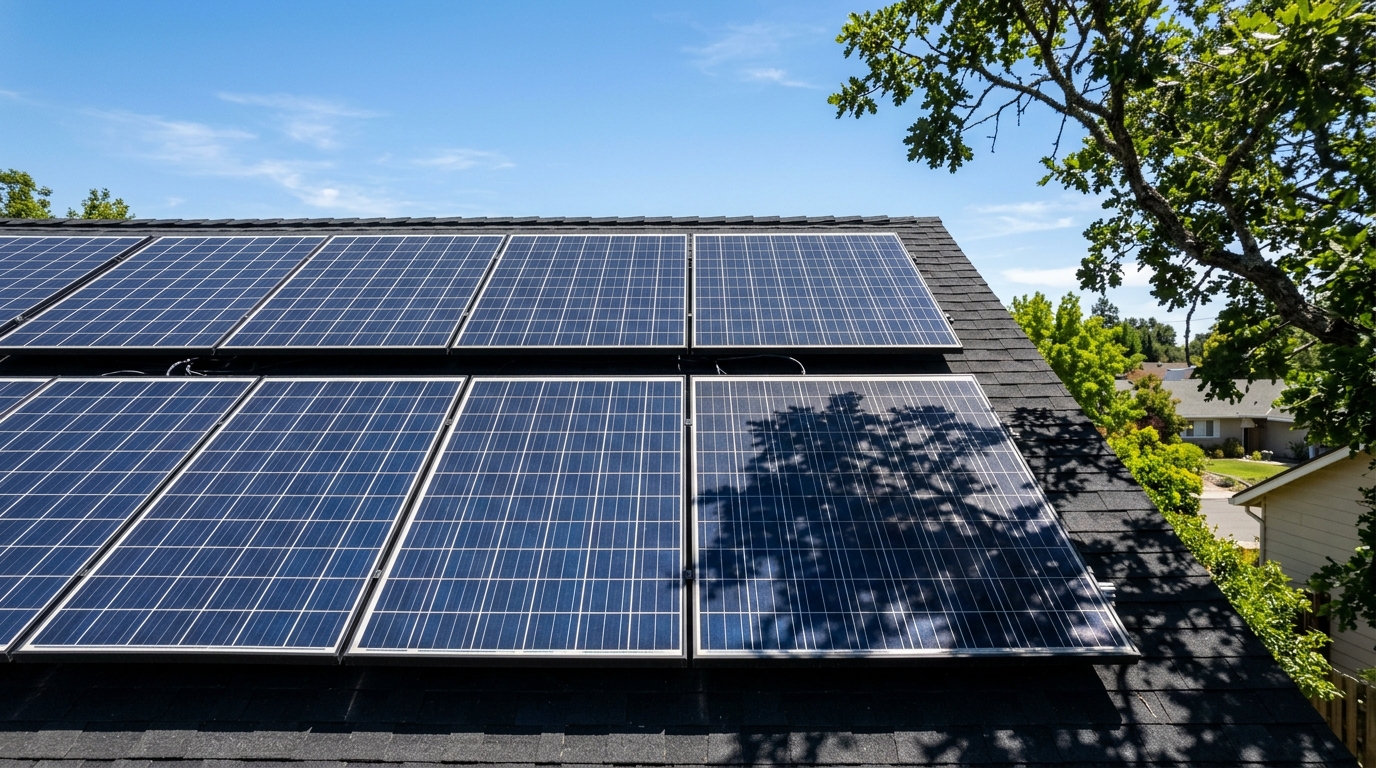
Shading is the number one killer of solar production, and it’s more destructive than most people realize.
Why Partial Shade Is So Devastating
Here’s the critical thing to understand: in a series string of panels (which is how most systems wire panels to a charge controller or string inverter), the weakest panel drags down the entire string. If one panel in a string of four is 50% shaded, you don’t lose 12.5% of total production — you can lose 40-50% or more.
This happens because shaded cells act as resistors. Current flow through the entire string is limited to what the weakest cell can produce. Bypass diodes help somewhat by allowing current to skip around heavily shaded sections, but they only activate when the shade is severe enough, and even then you lose the output of the bypassed section entirely.
A common scenario: a system loses significant production for weeks before the owner discovers the cause — a single tree branch that’s grown just enough to cast a shadow across the bottom edge of one panel during prime hours. The branch might be only two inches wide, shading a few cells, but those cells bottleneck the entire series string. Cut the branch, and production jumps back to normal the next day.
How to Check
- Watch your panels throughout the day. Not just at noon — check at 9 AM, 11 AM, 1 PM, and 3 PM. Shadows move.
- Look for unexpected shadow sources: Vent pipes, chimneys, satellite dishes, overhead wires, tree branches that have grown since installation, bird droppings (a large dropping on one cell acts just like shade).
- Check seasonally. The sun’s path changes throughout the year. A tree that doesn’t shade your panels in June might shade them in December when the sun is lower.
Fixes
- Trim trees and vegetation
- Relocate or extend arrays away from shadow sources
- Switch from a series string to parallel wiring or microinverters/power optimizers (these isolate shading effects to individual panels). Our series vs parallel wiring guide explains the tradeoffs in detail.
- Some MPPT charge controllers handle partial shading better than others — multi-tracker controllers like the EG4 6000XP with dual independent MPPT inputs can help if you split strings between shaded and unshaded roof faces
Step 3: Clean Your Panels
Dirty panels are the second most common cause of underperformance, and the easiest to fix.
What Builds Up
- Dust and pollen (5-15% loss if heavy)
- Bird droppings (localized hot spots and cell-level shading — a single large dropping can cost you more than general dust)
- Tree sap and sticky residue
- Snow and ice (obvious, but sometimes a thin layer of frost or ice persists longer than you’d think)
- Lichen or mold growth (more common on panels with low tilt angles in humid climates)
Cleaning Approach
- Garden hose with plain water handles 90% of cases. Spray panels down in early morning or late evening when they’re cool — spraying cold water on hot panels can cause thermal shock and micro-cracking.
- Soft sponge or squeegee with soapy water for stubborn residue. Dish soap works fine. Don’t use abrasive pads or pressure washers.
- Isopropyl alcohol for tree sap spots.
- Never walk on panels or lean on the glass surface.
Cleaning Schedule
In my experience, panels in most environments do fine with cleaning twice a year — once in spring (after pollen season) and once in fall. If you’re in a dusty area, near farmland, or under trees, quarterly cleaning makes sense. I’ve measured 8-12% production gains after cleaning panels that had been neglected for six months in a dusty environment.
Step 4: Check Your Wiring
Wiring problems range from obvious to maddeningly subtle. Here’s what to look for.
Visual Inspection
- MC4 connectors: Push and pull gently on each connection. They should be firmly seated with no play. A loose MC4 connector creates resistance, generates heat, and can eventually arc. I’ve seen melted MC4 connectors on systems where the installer didn’t fully click them together — our MC4 connector reference covers proper crimping and inspection.
- Wire damage: Look for cracked insulation, rodent chew marks (squirrels love solar wiring for some reason), and UV degradation on wire that isn’t rated for sunlight exposure.
- Junction box connections: If accessible, check that the wires inside panel junction boxes are secure. Corrosion here is a common failure point on older panels.
- Conduit integrity: Any conduit joints that have separated or conduit that’s taken damage can expose wire to moisture.
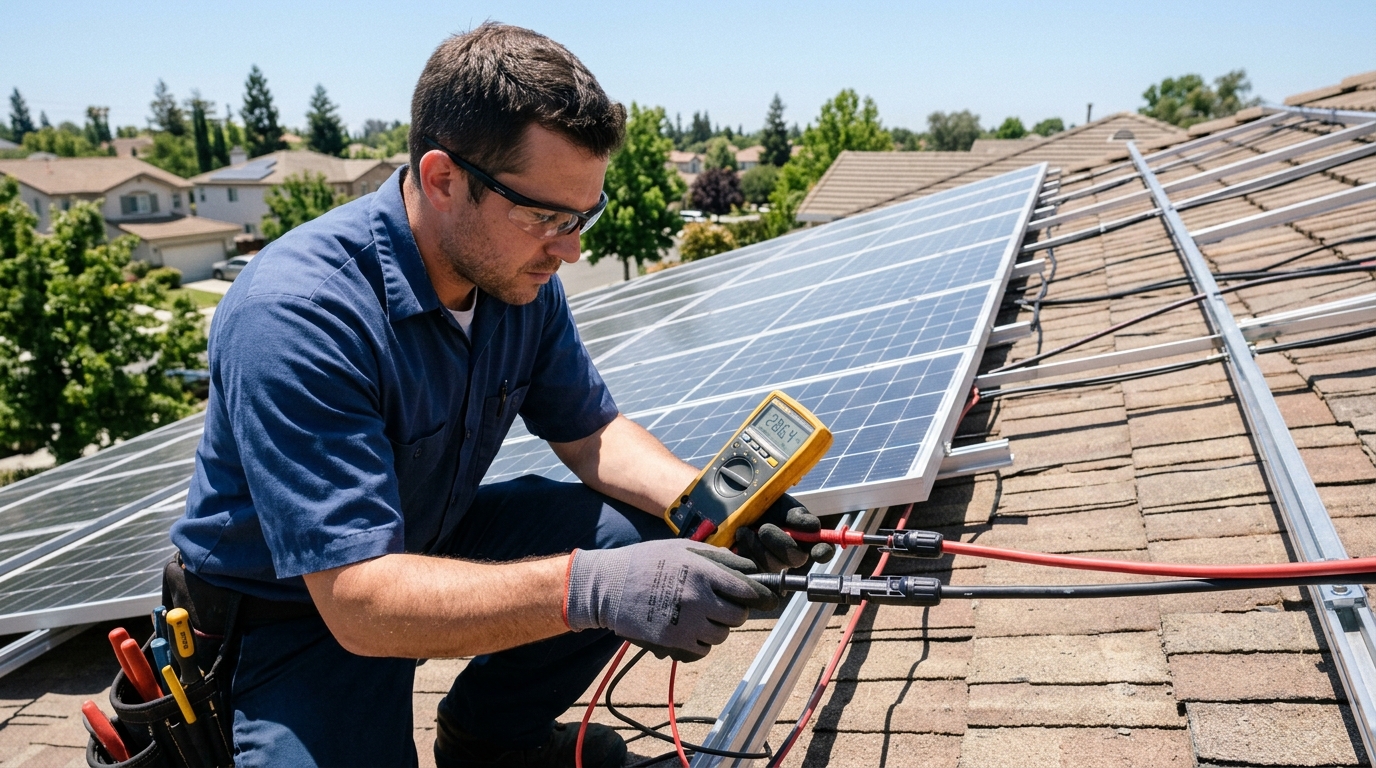
Voltage Drop Testing
Excessive voltage drop in your wiring steals power before it reaches your charge controller or inverter. This is especially common in 12V systems with long wire runs.
To test:
- Measure voltage at the panel output (right at the MC4 connectors).
- Measure voltage at the charge controller input terminals.
- The difference is your voltage drop.
If the drop is more than 3% of the panel voltage, your wire is undersized for the run. Check our Wire Gauge Calculator to see what gauge you actually need, or refer to our wire gauge reference chart for quick lookup tables.
Example: Panels producing 38V at the output, but the charge controller sees 35.5V. That’s a 2.5V drop (6.6%) — way too high. You’re losing real power to heat in the wire. Upsizing the wire or shortening the run will fix this.
Step 5: Check Your Charge Controller Settings
A misconfigured charge controller is a surprisingly common problem, especially after firmware updates or accidental resets.
Settings to Verify
- Battery type: Make sure it’s set to the correct chemistry. A controller set to “flooded lead-acid” while connected to LiFePO4 batteries will use wrong voltage setpoints, potentially undercharging the batteries and making you think the panels are underperforming. If you’re running a DIY LiFePO4 bank, our battery build guide lists the correct charge parameters for common BMS and inverter setups.
- Absorption voltage: For LiFePO4, this is typically 14.2-14.6V (per 12V battery). For flooded lead-acid, 14.4-14.8V. If set too low, the controller will throttle panel input prematurely.
- Float voltage: LiFePO4 is typically 13.4-13.6V. Lead-acid is 13.2-13.5V.
- Max input voltage: Verify your panel string voltage doesn’t exceed the controller’s maximum. If it does, the controller may shut down or limit current to protect itself.
- Max input current: Some controllers will limit current if the array exceeds the controller’s rated current. This isn’t a fault — it’s the controller protecting itself. But if you intended to capture full array output, you need a larger controller — see our best MPPT charge controllers for 2026 roundup for tested replacements.
How to Tell If It’s the Controller
If your panels produce good voltage and current at the MC4 connectors (measured with a multimeter directly), but the charge controller displays significantly lower input power, the issue is either the wiring between panels and controller (voltage drop) or the controller settings/capacity. Our MPPT charge controller sizing and install guide walks through the diagnostic settings to check.
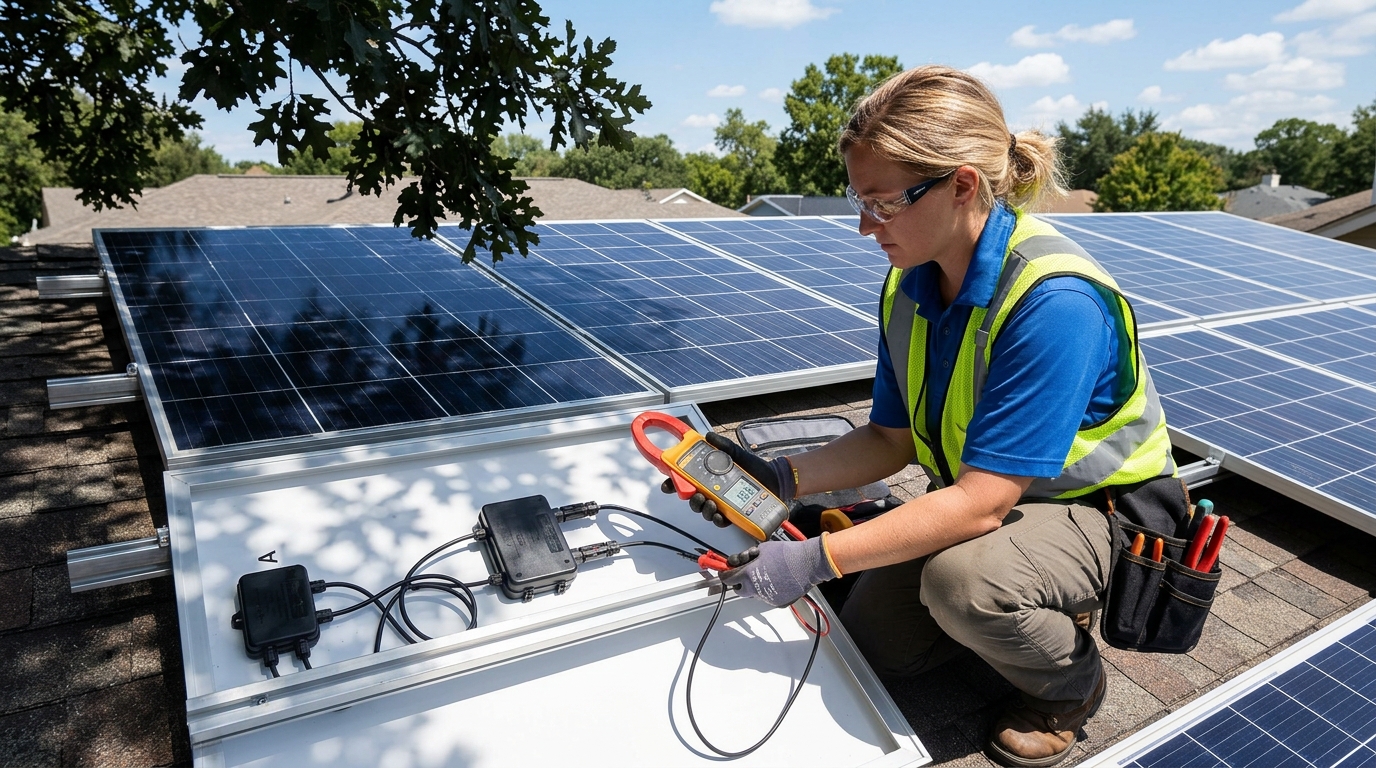
Step 6: Take Multimeter Readings
A multimeter is the single most useful diagnostic tool for solar. Here’s exactly what to measure and what the numbers should look like.
Open Circuit Voltage (Voc)
How to measure: Disconnect the panel or string from everything. Set multimeter to DC voltage. Touch probes to positive and negative leads.
What you should see: Within 5-10% of the panel’s rated Voc (listed on the data sheet). For a typical 400W panel, Voc is usually 40-50V. For a 4-panel series string, expect 160-200V.
If it’s significantly low:
- One or more panels may have a damaged bypass diode or internal cell failure
- A connection within the string is corroded or loose
- One panel is heavily shaded (even if others aren’t)
If it’s zero: Check for a blown fuse in the combiner box, a tripped disconnect, or a broken wire.
Short Circuit Current (Isc)
How to measure: Disconnect the panel from everything. Set multimeter to DC current (10A or higher range). Connect probes directly across the positive and negative leads. Do this quickly — you’re shorting the panel through the meter, which is safe for short periods but generates heat in the meter’s internal shunt.
What you should see: Within 10-20% of rated Isc in full sun conditions. For a 400W panel, Isc is typically 10-13A. On a partly cloudy day, it will be proportionally lower.
If it’s significantly low in full sun:
- Panel degradation or damage
- Dirty panel surface
- Partial shading
- Panel defect (manufacturing issue or impact damage to cells)
Operating Voltage and Current
How to measure: With the system running normally, measure voltage at the charge controller input terminals. Note the current on the charge controller display.
What to look for: Compare the power (V × A) to what the array should produce under current conditions. If your 1600W array is producing 400W at solar noon on a clear day, something is definitely wrong.
Step 7: Panel Degradation — Is It Normal Aging?
All solar panels degrade over time. Most manufacturers guarantee no more than 0.5% degradation per year, with many newer panels warranting 0.25-0.4% per year.
What This Looks Like
- A 400W panel after 10 years at 0.5%/year: 400 × (1 - 0.05) = 380W
- A 400W panel after 20 years at 0.5%/year: 400 × (1 - 0.10) = 360W
That’s 380W and 360W at STC — in practice, subtract another 15-25% for real-world conditions.
When It’s Abnormal
If your panels are 3 years old and producing 20% below rating, that’s not degradation — that’s a problem. Common causes of accelerated degradation:
- Micro-cracking from impact, improper handling, or poor mounting that allows flex
- Potential Induced Degradation (PID) — a voltage-related phenomenon more common in high-voltage strings with poor grounding
- Hot spots from sustained partial shading causing localized overheating and cell damage
- Delamination — moisture ingress between the glass and encapsulant, visible as cloudy or discolored patches
If you suspect abnormal degradation, compare individual panel Voc readings across all your panels. Panels from the same batch should read within 1-2V of each other. A panel reading significantly lower has an issue.
Step 8: Inverter Clipping
If you have a grid-tied system or a hybrid inverter, inverter clipping can look like underperformance even though everything is working correctly.
What Is Clipping?
Clipping happens when your panel array can produce more DC power than the inverter can convert to AC. A 5kW inverter paired with 6.5kW of panels will “clip” — it caps AC output at 5kW even when the panels could deliver more.
Is Clipping a Problem?
Usually, no. System designers intentionally oversize the array relative to the inverter (called the DC/AC ratio) because panels rarely produce at full rated power. A 1.2-1.3 DC/AC ratio is common and generally improves annual energy production because it boosts output during non-peak hours more than it loses during the few peak hours of clipping.
How to Tell If You’re Clipping
Look at your production graph over a clear day. If the curve has a flat top around midday (instead of a smooth bell curve), your inverter is clipping. Check if the flat portion matches your inverter’s rated AC output.
If you’re clipping for more than 2-3 hours daily in summer, your DC/AC ratio might be too aggressive. But for most systems, moderate clipping is by design and represents the optimal economic balance.
Diagnostic Flowchart (Text Version)
Run through this in order. Stop when you find the issue.
- Is production low relative to conditions? Check weather, time of day, season. If production matches conditions, your expectations needed adjusting — use the System Sizer to verify.
- Is any part of any panel shaded? Check at multiple times of day. Even small shadows on series strings cause large losses.
- Are panels clean? Inspect the glass surface. Hose them down and recheck production.
- Are all connections secure? Physically inspect every MC4 connector, junction box, and terminal connection.
- Is voltage drop excessive? Measure voltage at panels vs. at controller input. More than 3% drop means wire is undersized — check with the Wire Gauge Calculator.
- Is the charge controller configured correctly? Verify battery type, absorption voltage, and float voltage settings.
- What does the multimeter say? Measure Voc and Isc on individual panels. Compare to data sheet ratings and to each other.
- Is the inverter clipping? Check for a flat-topped daily production curve at the inverter’s rated AC output.
- How old are the panels? Calculate expected degradation (0.5%/year) and compare.
- Still stuck? You might have an internal panel defect, a controller fault, or an inverter issue. At this point, contacting the manufacturer or a local solar professional is reasonable.
Tools You Need for Solar Diagnostics
You don’t need much:
- Digital multimeter capable of DC voltage (at least 200V range) and DC current (at least 10A range). A $30-40 unit works fine. I use a Fluke 117 which is overkill for hobby use but has been bulletproof for years.
- Clamp meter (optional but helpful) — lets you measure current without disconnecting wires. Especially useful for measuring string current without breaking the circuit.
- Infrared thermometer (optional) — useful for checking if specific cells or connections are running hotter than neighbors, which indicates a fault.
When to Call a Professional
DIY troubleshooting handles most issues, but some situations warrant calling in a licensed electrician or solar technician:
- Arcing or burn marks on any connector or wire — this is a fire hazard
- Ground fault indicators on your inverter or charge controller
- Suspected panel defects covered under warranty (manufacturer may require professional inspection for a claim)
- Any work on your AC panel or utility interconnection — code compliance and safety require licensed work in most jurisdictions
- Rapid shutdown compliance issues — NEC 690.12 requirements can be complex
Wrapping Up
Most low-output issues have simple causes: wrong expectations, shade, dirt, or a loose connector. Start at the top of the diagnostic flowchart and work your way down. In my experience, about 90% of problems are found in the first four steps.
If you’re designing a new system and want to avoid wiring-related losses from the start, check out our wire gauge reference chart and use the Wire Gauge Calculator to size everything correctly before you buy.
And if you’re not sure whether your system should be producing more than it is, run your specs through the Solar System Sizer — it’ll give you a realistic baseline for your location and setup.
Frequently Asked Questions
Why are my solar panels producing less than rated wattage?
Panel ratings are based on Standard Test Conditions (1000 W/m2, 25 degrees C) that rarely occur simultaneously in reality. Expect 75-85% of rated power on clear days at noon. Heat, dust, wiring losses, and non-optimal angles further reduce real-world output by 15-25%.
How much does shading reduce solar panel output?
Shading is extremely destructive in series-wired strings. Covering just 12.5% of total panel area can cause a 50%+ drop in output because the weakest panel limits the entire string's current. Parallel wiring or microinverters isolate shading effects to individual panels.
How often should I clean my solar panels?
Most panels do fine with cleaning twice a year — once in spring after pollen season and once in fall. In dusty areas or under trees, clean quarterly. Neglected panels can lose 8-12% of production from accumulated grime. Use plain water with a soft sponge; never use pressure washers.
What is inverter clipping and is it a problem?
Clipping happens when your panel array produces more DC power than the inverter can convert to AC. The production graph shows a flat top at midday. A 1.2-1.3 DC/AC ratio is common and intentional — it boosts output during non-peak hours more than it loses during peak clipping.
How fast do solar panels degrade over time?
Most manufacturers guarantee no more than 0.5% degradation per year, with newer panels warranting 0.25-0.4%. A 400W panel after 10 years at 0.5%/year still produces about 380W at STC. If output drops more than 20% in 3 years, you have a problem — not normal degradation.
Anthony
Solar homeowner, EV driver, and DIY builder. Using solar to power a large part of my home.
Get build guides in your inbox
Weekly solar builds, product tests, and technical deep-dives.
Subscribe Free